

Multi-Timeframe Analysis: How to Use It Without Overcomplicating
Multi-timeframe analysis does not need five charts open at once. Here is a simple, practical way to use it that actually…
Read article →
Pullback vs Reversal: How to Tell the Difference
A pullback and a reversal look the same at first. Here is how to tell which one you are actually looking at, and what to…
Read article →
Breakout Trading: How to Tell a Real Breakout from a Fake One
Fake breakouts trap more traders than any other pattern. Here is how to tell a real breakout from a fake one before…
Read article →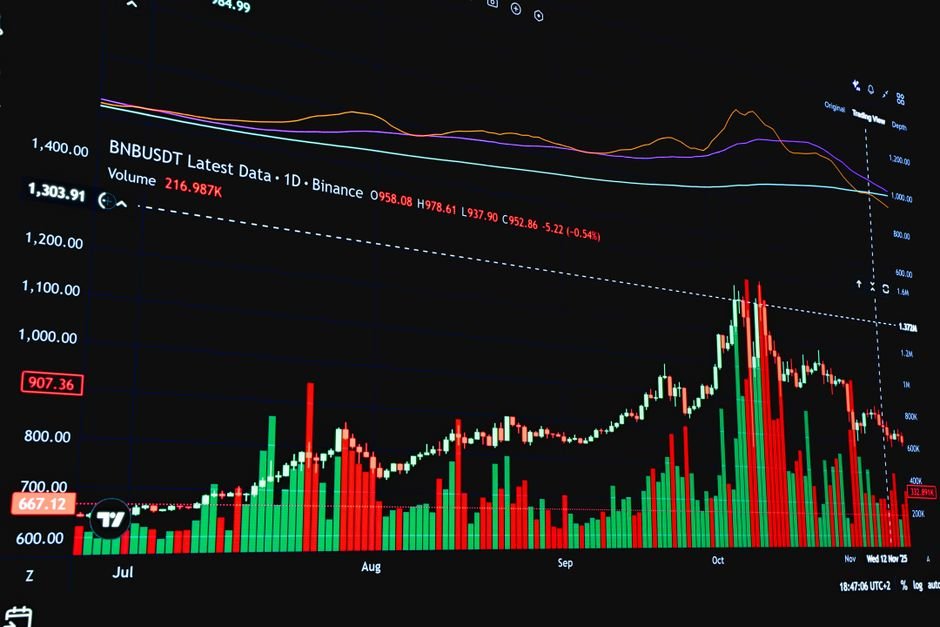
How to Read Volume Alongside Price Action
Price tells you what happened. Volume tells you how convinced the market was. Here is how to read the two together…
Read article →
Price Action Trading: A Practical Guide
Price action trading explained without the jargon. What it actually means, the core building blocks, and how to build…
Read article →
Round Number Psychology: Why Prices Stall at 100, 200, 500
Why do stocks and indices keep stalling at round numbers like 24,000 or 500? The real reason is human behaviour, not the…
Read article →
Supply and Demand Zones vs Support and Resistance
Supply and demand zones and support and resistance are not the same thing. Here is how they differ, and how to mark…
Read article →
Trendlines: How to Draw Them Correctly
Most trendlines are drawn wrong. Here is how to draw a trendline that actually means something, and how to trade a break…
Read article →